Slow network is a common phenomenon. For the diversity of the reasons causing slow network, to troubleshoot slow network is one of the most common and troublesome work in daily network management. it’s a challenge to identif the root cause too. Slow server response is a typical reason. Next, we will demonstrate how to find the reason with Ax3soft Unicorn analyzer.
Start capturing packets at the client endpoint
Let’s launch Unicorn and start capturing packet. Often, when first analyzing a slow application, it is easiest to start at the client endpoint. the packets will be much simpler and easier to read when only one client experience is captured. Make sure that while capturing, the user is able to reproduce the performance problem.
Look for TCP server slow response events
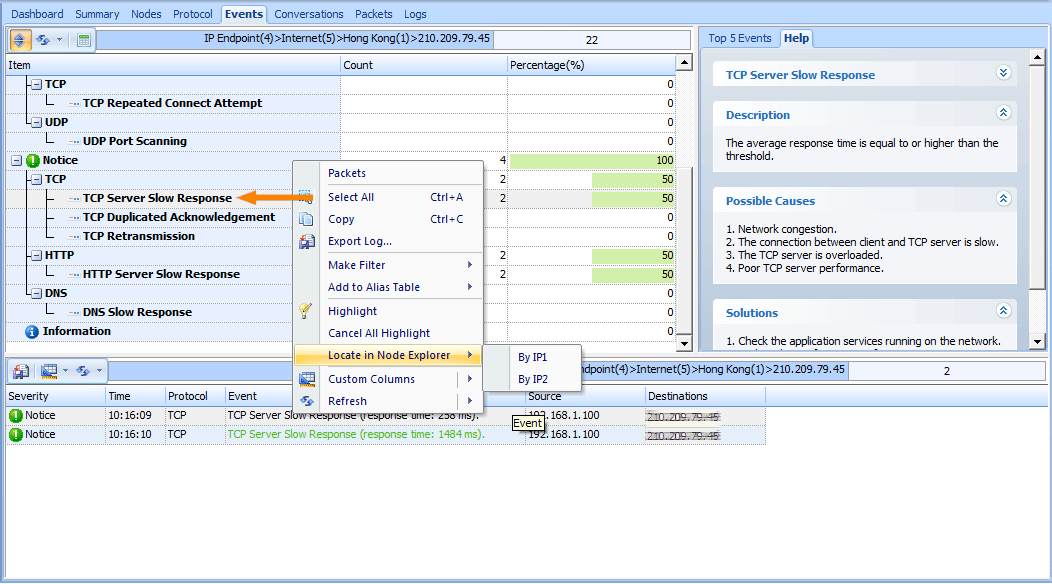
To look for TCP server slow response, please switch to Events Tab. All events be detected are listed in the window, it is ease and intuitive to look for it. See the figure below, there are two events, To click the TCP Server Slow Response item in left-up window, then we will see all events detail related to the item.
Figure 1: Look for TCP Server Slow Response in Event Tab
Look for client connecting to server
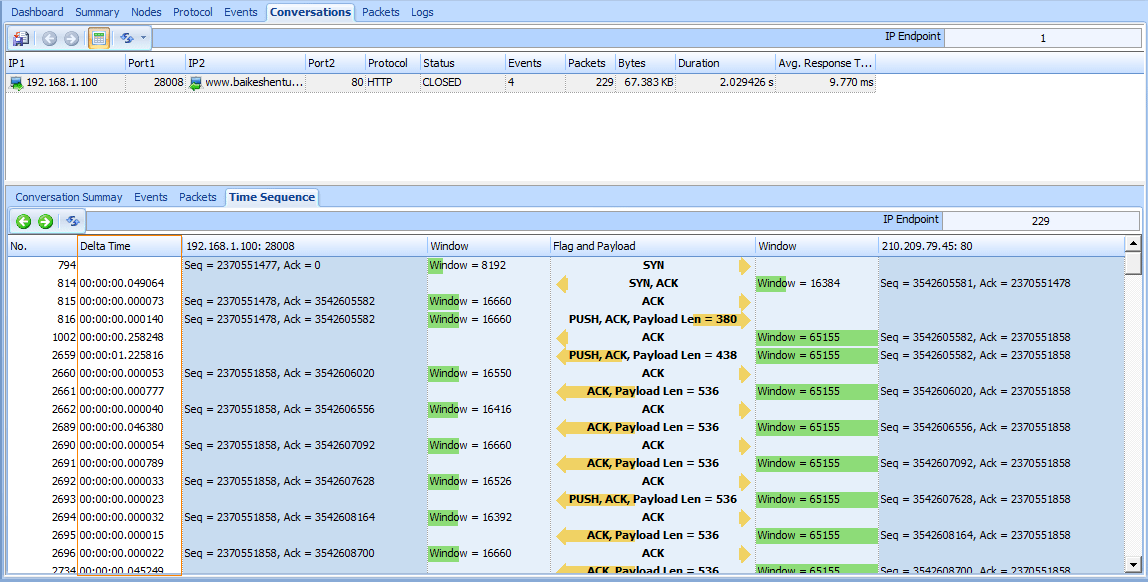
It is very difficult to look for a connection from a lot of connections. Don’t worry about it. Unicorn offer a simple and effective method, That’s Node Explore. It let’s to easily isolate this connection. Clicking the right button of mouse on a item selected in the events log window to display a pop-up menu, next, clicking the Locate in Node Explore>By IP2 sub menu item. It’s ok. The goal in isolating this connection is to compare the network roundtrip time to the server response time. Then we switch to connections tab to view connections isolated. Please see figure below.
Note: When measuring application response, be sure to use a delta timer that shows the amount of time between packets.
Figure 1: Look for client connecting to server
Once this connection is isolated, look at the delta time between the TCP SYN sent by the client and the TCP SYN-ACK sent back from the server. This can be used as a benchmark connection setup time. In the picture above, the response from the server is displayed in packet 814. It took 49msec to hear back from the server.
Measure application response time – compare to connection setup time
Next, after the TCP connection has been established, the client will request data from the server. In the web-based application above, the client performs an HTTP GET. Use the delta time column to see how long it takes the server to respond to this request. In our example above, the server responds after 258msec with a TCP ACK. This indicates that the server received the request, but has not yet responded with actual data. After waiting 1.22 SECONDS, the server finally sends a packet with application data. After this, packets are flying by at wire-speed. Comparing 1.22 seconds to the connection setup time, 258msec, we see that the server response time is very slow.
Server, client or network delay?
From this information, it is simple to determine where to troubleshoot next. If the server response time is significantly higher than the connection setup time, and there are no TCP retransmissions, the problem is on the server endpint. In the case above, the server responded to the request with an ACK, showing it received the request and was busy processing it. The network is not to blame for this delay.
If any retransmissions are observed, the network is dropping packets somewhere. The server may not be to blame for slow performance, especially if it isn’t getting requests in the first place.


