In order for network communication to take place, you must have data flowing between at least two devices. An endpoint is a device that sends or receives data on the network. For instance, there are two endpoints in TCP/IP communication: the IP addresses of the systems sending and receiving data, such as 192.168.1.25 and 192.168.1.30.
For example, on layer 2, the communication takes place between two physical NICs and their MAC addresses. If the NICs sending and receiving
data have addresses of 00:ff:ac:ce:0b:de and 00:ff:ac:e0:dc:0f, those addresses are the endpoints of communication, as you can see in Figure 5-1.
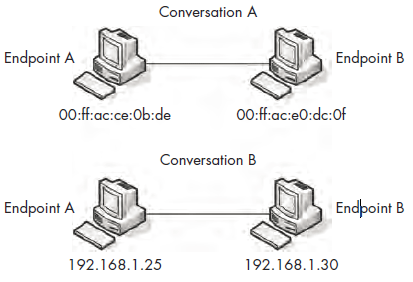
Figure 5-1: Endpoints on a network
A conversation on a network, like a conversation between two people, describes the communication that takes place between two hosts (endpoints). For example, Jim and Sally’s conversation might consist of, “Hey, how are you?” “I’m great! Yourself?” and “Couldn’t be better!” A conversation between 192.168.1.5 and 192.168.0.8 might look like “SYN,” “SYN/ACK,” and “ACK.” (We’ll look at the TCP/IP communication process in more detail in Chapter 6.)
Viewing Endpoints
When analyzing traffic, you may find that you can pinpoint a problem to a specific endpoint on a network. Unicorn’s Nodes tab (Statistics Endpoints) shows several helpful statistics for each endpoint (see Figure 5-2), including the addresses and the number of packets and bytes transmitted and received by each.
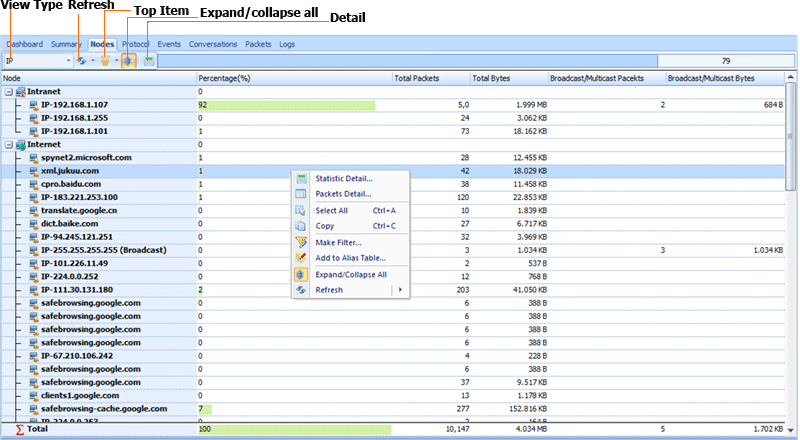
Figure 5-2: The Endpoints window lets you view each of the endpoints in a capture file.
Nodes statistics display real-time data organized by network node. You can view Nodes statistics in a hierarchy view or in a variety of flat views. You can click left mouse button on any column header to sort the list. You also click right mouse button on any column header to show a popup menu, it allow you to show or hide any column, set width of column and so on. Double-click left buffer of mouse on a endpoint selected, Which’s detail is display, see figure below. he detail window display the details of the node selected on the Nodes view. It was divided into three parts (Nodes detail window, protocol detail window and chart). All nodes to communicate with the node selected on the Nodes view are listed in nodes detail window; all protocols to be used for communication are listed in protocols detail window;
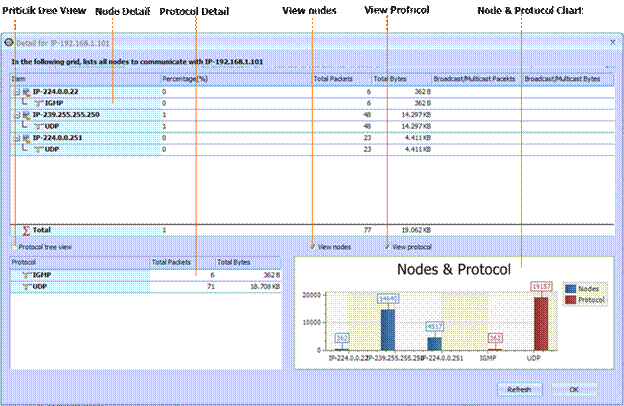
Figure 5-3: Display detail of node selected.
You can use the Endpoints window to filter out specific packets for display in the Packet List pane. Right-click a specific endpoint to display the popup-menu and chose Locate in node Explorer.
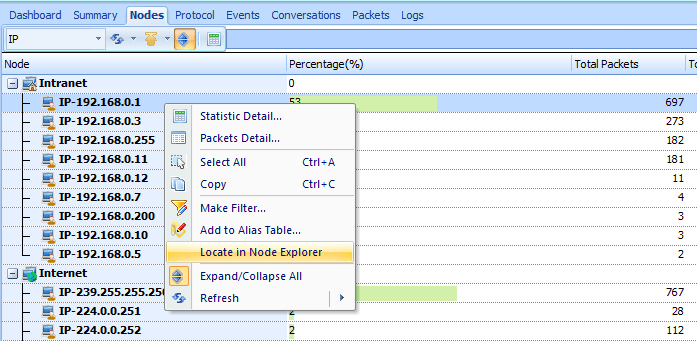
Figure 5-3: Locate in node explorer
Viewing Network Conversations
The Unicorn Conversations tab (StatisticsConversations), shown in Figure 5-4, displays the addresses of the endpoints involved in the conversation listed as Address A and Address B, and the packets and bytes transmitted to and from each device.
The conversations listed in this window are divided by the protocol they use. Right clicking a specific conversation allows you to create filters that may be useful, such as displaying all traffic transmitted from device A, all traffic received by device B, or all traffic communicated between devices A and B.
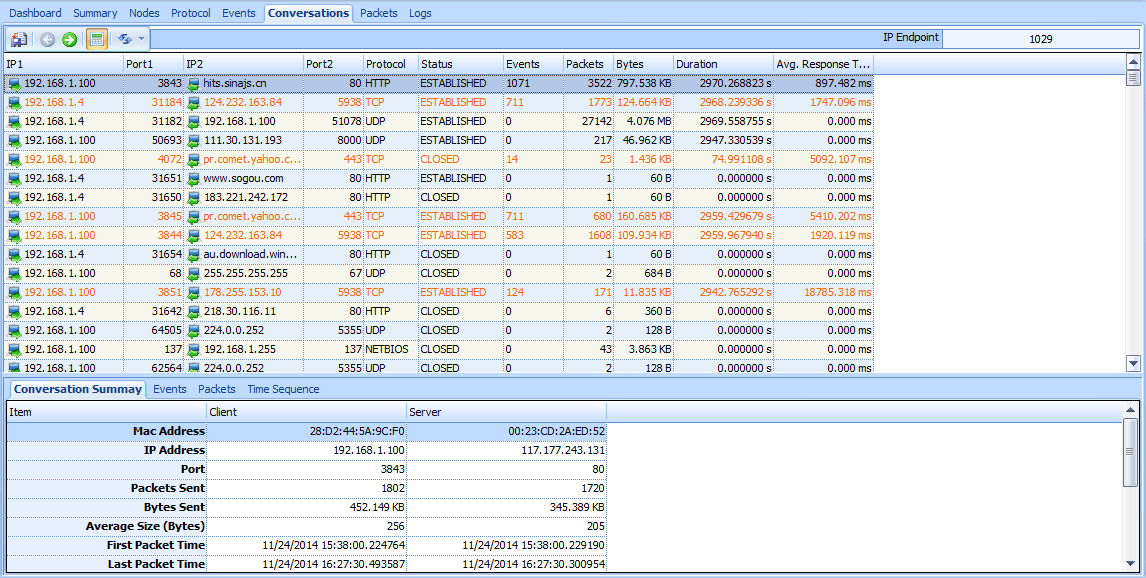
Figure 5-4: The Conversations window lets you interact with each conversation in a capture file.
Troubleshooting with the Endpoints and Conversations Windows
The Endpoints and Conversations windows are crucial in network troubleshooting, especially when you’re trying to locate the source of a significant amount of traffic on the network or determine which one of your servers is talking the most.
For example, when you open the file lotsofweb.pcap, you will see a lot of HTTP traffic representing multiple clients browsing the Internet. If you start by viewing the Endpoints window, you can immediately draw some conclusions about the traffic you are viewing.
Looking at the Nodes tab (see Figure 5-5), you see that your first address when sorting by bytes is the local 192.168.1.101 address, meaning this device on your network is the top talker (host responsible for the most communication) among your data set. The second node is www.ids-sax2.com. address of 67.210.106.242 is a non local address, so at this point, you can assume that you have one client talking to this IP address a lot, or that multiple clients are talking to it a moderate amount.
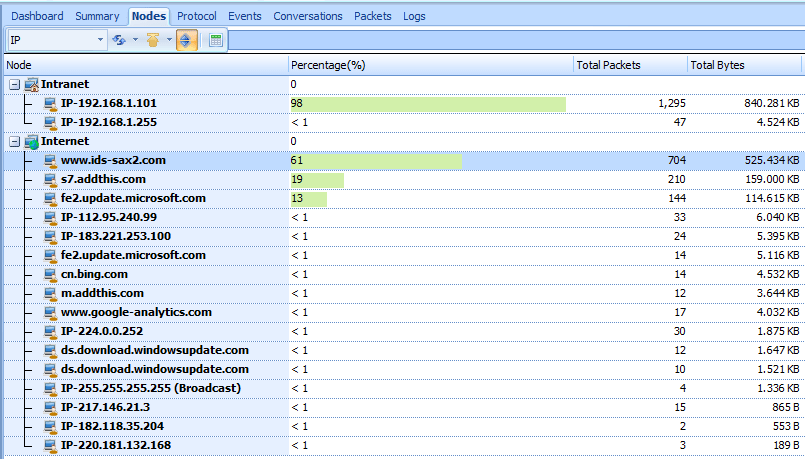
Figure 5-5: The Endpoints window shows which hosts are talking the most.
You locate the node (67.210.106.242) in node explore and switch to conversation tab, you will see all conversations relate to the node. In this view, you can see that the traffic is consistent with a file download, because the number of bytes transmitted from server (67.210.106.242) greatly outnumbers the number of bytes transmitted from
Client (192.168.1.101) (see Figure 5-6).
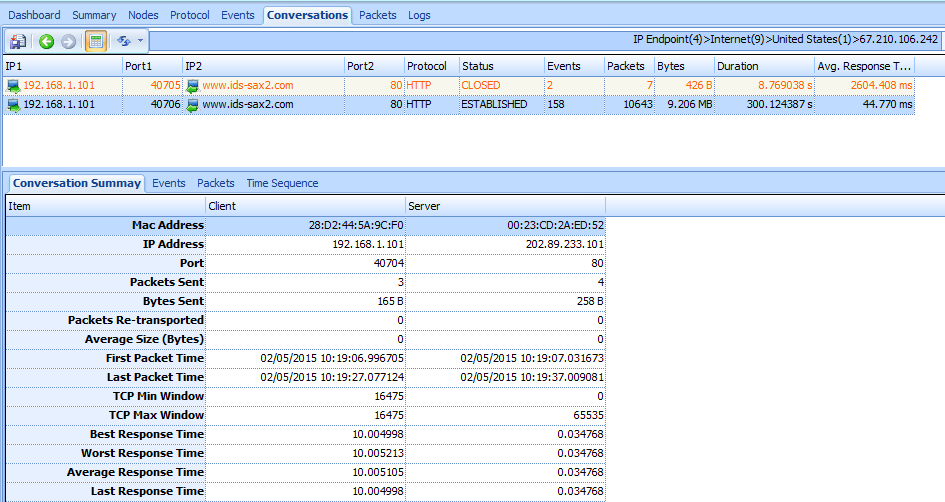
Figure 5-6: The Conversations window confirms that the two top talkers are communicating with each other.
You will see how to use the Endpoints and Conversations windows in practical scenarios later in this book.