

Preface
The most common bottlenecks in MySQL databases typically involve CPU and I/O performance. CPU saturation often occurs when loading data into memory or reading from the disk, whereas disk I/O bottlenecks arise when the amount of data being loaded exceeds the available memory capacity. When MySQL database performance encounters these bottlenecks, it is essential for every DBA or system administrator to quickly identify the underlying issues. Utilizing MySQL performance analysis tools can greatly facilitate the swift and accurate diagnosis of problems.
Here is a curated collection of indispensable MySQL performance analysis tools that DBAs frequently depend on. Be sure to bookmark this list and share it with others!
1. Pt-query-digest
pt-query-digest is primarily used to analyze MySQL slow logs. Compared to the mysqldumpshow tool, pt-query-digest provides more detailed and comprehensive analysis results. pt-query-digest is a subset of the PT toolkit.
- Installation
yum install percona-toolkit-3.0.13-1.el7.x86_64.rpm- Usage (1) Directly analyze a slow query file:
pt-query-digest /var/lib/mysql/slowtest-slow.log > slow_report.log(2) Analyze queries from the last 12 hours:
pt-query-digest --since=12h /var/lib/mysql/slowtest-slow.log > slow_report2.log(3) Analyze queries within a specific time range:
pt-query-digest /var/lib/mysql/slowtest-slow.log --since '2017-01-07 09:30:00' --until '2017-01-07 10:00:00' > slow_report3.log(4) Analyze slow queries containing SELECT statements:
pt-query-digest --filter '$event->{fingerprint} =~ m/^select/i' /var/lib/mysql/slowtest-slow.log > slow_report4.log(5) Analyze slow queries for a specific user:
pt-query-digest --filter '($event->{user} || "") =~ m/^root/i' /var/lib/mysql/slowtest-slow.log > slow_report5.log(6) Analyze slow queries involving full table scans or full joins:
pt-query-digest --filter '(($event->{Full_scan} || "") eq "yes") ||(($event->{Full_join} || "") eq "yes")' /var/lib/mysql/slowtest-slow.log > slow_report6.log2. Innotop
Innotop is a MySQL and InnoDB transaction/state monitor that displays queries, InnoDB transactions, lock waits, deadlocks, foreign key errors, open tables, replication status, buffer pool information, row operations, logs, I/O operations, and load graphs. Innotop allows you to monitor multiple servers simultaneously.
- Install innotop
yum install innotop-1.11.4-1.el7.noarch- Usage (1) Basic usage:
innotop --host 192.168.1.181 --user admin --password 123456 --port 3306 --delay 1 -m Q3. Orzdba
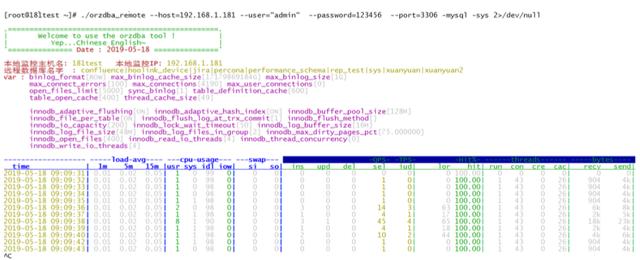
Orzdba, an open-source tool from Taobao, allows real-time performance monitoring of databases. With this tool, you can keep track of your database’s performance at all times.
- Usage
./orzdba_remote --host=192.168.1.181 --user="admin" --password=123456 --port=3306 -mysql -sys 2>/dev/nullExplanation of parameters:
--host: Specifies the host--user: Specifies the username--password: Database password--port: Database port number
4. Tcpdump
- Install tcpdump
yum install tcpdump-4.9.2-3.el7.x86_64 -y- Usage (1) Capture packets using tcpdump:
tcpdump -i any port 3306 -l -s 0 -w - | strings | grep -A 5 select | less(2) Tcpdump + pt-query-digest:
   tcpdump -s 65535 -x -nn -q -tttt -i any -c 1000 port 3306 > mysql.tcp.txt
   pt-query-digest --type tcpdump mysql.tcp.txt > slow_report9.log
5. ioprofile
- pt-ioprofile pt-ioprofile helps locate the source of the load by identifying processes with high load through
ps. - Usage
pt-ioprofile --profile-pid=12036 --cell=sizes6. Tcprstat
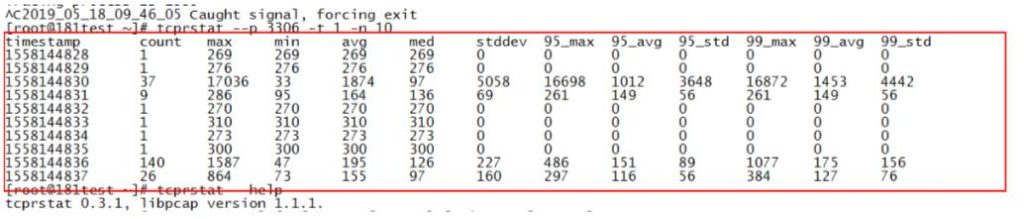
Tcprstat assesses the database’s health by measuring response times.
- Install tcprstat On a 64-bit OS, download the binary file:
   wget http://github.com/downloads/Lowercases/tcprstat/tcprstat-static.v0.3.1.x86_64
   mv tcprstat-static.v0.3.1.x86_64 /usr/bin/tcprstat
chmod +x /usr/bin/tcprstat- Usage
[root@localhost ~]# tcprstat --p 3306 -t 1 -n 10
timestamp count max min avg med stddev 95_max 95_avg 95_std 99_max 99_avg 99_std
1539760803 1 103 103 103 103 0 0 0 0 0 0 0
1539760804 1 108 108 108 108 0 0 0 0 0 0 0
1539760805 1 124 124 124 124 0 0 0 0 0 0 0
1539760806 1 115 115 115 115 0 0 0 0 0 0 0
1539760807 1 112 112 112 112 0 0 0 0 0 0 0
The time for each request is between 0.1ms and 0.124ms.
Explanation of parameters:
--p: Database port number-t: Refresh interval time-n: Number of outputs
7. Nicstat
Nicstat is a network monitoring tool that provides detailed information about your network card’s performance.
- Install nicstat
yum install http://rpmfind.net/linux/fedora/linux/releases/28/Everything/x86_64/os/Packages/n/nicstat-1.95-7.fc27.x86_64.rpm- Usage
   [root@lkjtest ~]# nicstat -z 1
 Time Int rKB/s wKB/s rPk/s wPk/s rAvs wAvs %Util Sat
15:29:14 ens160 4.03 0.91 43.18 1.60 95.61 581.8 0.00 0.00
15:29:15 ens160 3.09 0.73 35.95 2.00 88.11 375.5 0.00 0.00
15:29:16 ens160 3.93 0.66 43.99 2.00 91.52 335.5 0.00 0.00
15:29:17 ens160 3.99 0.66 45.00 2.00 90.71 335.5 0.00 0.00
15:29:18 ens160 4.04 0.66 46.99 2.00 88.04 335.5 0.00 0.00
15:29:19 ens160 3.64 0.66 42.00 2.00 88.76 335.5 0.00 0.00
Explanation of parameters:
-z: Skip 0 rows
Output parameter explanations:
wKB/s, OutKB: Number of kilobytes transmitted per secondrMbps, RdMbps: Number of megabytes received per second%Util: Percentage of interface utilizationSat: Number of errors per second, an indicator that the interface is nearing saturation
8. Dstat
- Install dstat
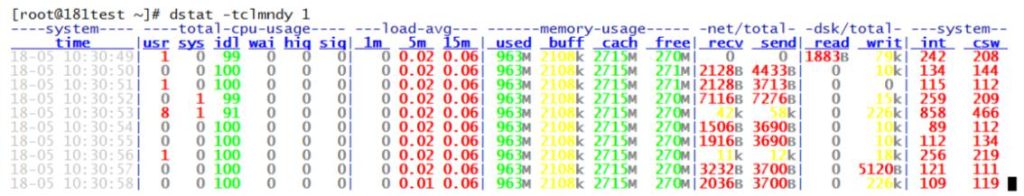
yum install dstat -y- Usage
dstat -tclmndy 1Explanation of parameters:
- -t:enable time/date output
- -c:enable cpu stats
- -l:enable load stats
- -m:enable memory stats
- -n:enable network stats
- -d:enable disk stats
- -y:enable system stats
9. Vmtouch
Vmtouch is a tool for learning and controlling the file system cache on Unix and Unix-like systems.
- Quick installation
   git clone https://github.com/hoytech/vmtouch.git
   cd vmtouch
   make
sudo make install- Usage
vmtouch -v big-dataset.txtDisplay
vmtouch -ve a.txt 10. Oprofile
Oprofile is an open-source profiling tool that samples data to help pinpoint CPU-intensive processes.
- Install
yum install http://www.rpmfind.net/linux/centos/7.5.1804/os/x86_64/Packages/oprofile-0.9.9-25.el7.x86_64.rpm -yHere’s the translation of the provided content:
2. Usage Instructions
(1) Usage
# Load the oprofile kernel module
opcontrol --init
# We are not interested in sampling the kernel
opcontrol --setup --no-vmlinux
# Review our settings before starting to collect sample data
opcontrol --status
# Clear the data from the last sampling
opcontrol --reset
# Run our program
opcontrol --start
# Collect sample data
opcontrol --dump
# Shut down the daemon and prepare the sampled data
opcontrol --shutdown
Note: If you see the error “Cannot find event CPUCLKUNHALTED,” follow these steps to resolve it:
Resolution Steps
$sudo opcontrol --deinit
Daemon not running
Unloading oprofile module

$sudo modprobe oprofile timer=1

$dmesg | grep oprofile | tail -n 1
oprofile: using timer interrupt.
If you see the above message, you have succeeded.
Let's try again:
$sudo opcontrol --init && sudo opcontrol --reset && sudo opcontrol --start
Using 2.6+ OProfile kernel interface.
Using log file /var/lib/oprofile/samples/oprofiled.log
Daemon started.
Profiler running.
(2) Obtain Sample Information
# System-level
opreport --long-filenames
# Module-level
opreport image:foo -l
# Source-level
opannotate image:foo -s
(3) Usage Example
opcontrol --deinit
modprobe oprofile timer=1
$dmesg | grep oprofile | tail -n 1
(oprofile: using timer interrupt.)
opcontrol --reset
opcontrol --separate=lib --no-vmlinux
--start --image=/home/mysql_user/mysqlhome/bin/mysqld
opcontrol --dump
opcontrol --shutdown
opreport -l /home/mysql_user/mysqlhome/bin/mysqld